Need Optical Advice?


As the weather is declining in the winter months with snowstorms and dangerous ice, now is the time to ensure we are driving at our safest and not a danger to ourselves or other road users.
As well as increasing your risk of getting into an accident, you may also be disqualified from driving if your eyesight is an impairment for you and fellow road users. We were curious to understand what the impact of disqualified drivers was across the country, so we obtained the relevant data through a Freedom of Information (FOI) request with the Driver and Vehicle Agency (DVLA).
Interestingly, the Orkney Islands in Scotland topped the rankings, with more than 1 in 10 of its qualified drivers being stripped of their licenses.
The highest proportion of the UK’s disqualified drivers can be found in Scotland and Wales according to this new data from the DVLA, the following heatmap breaks down the disqualification percentage across the country:
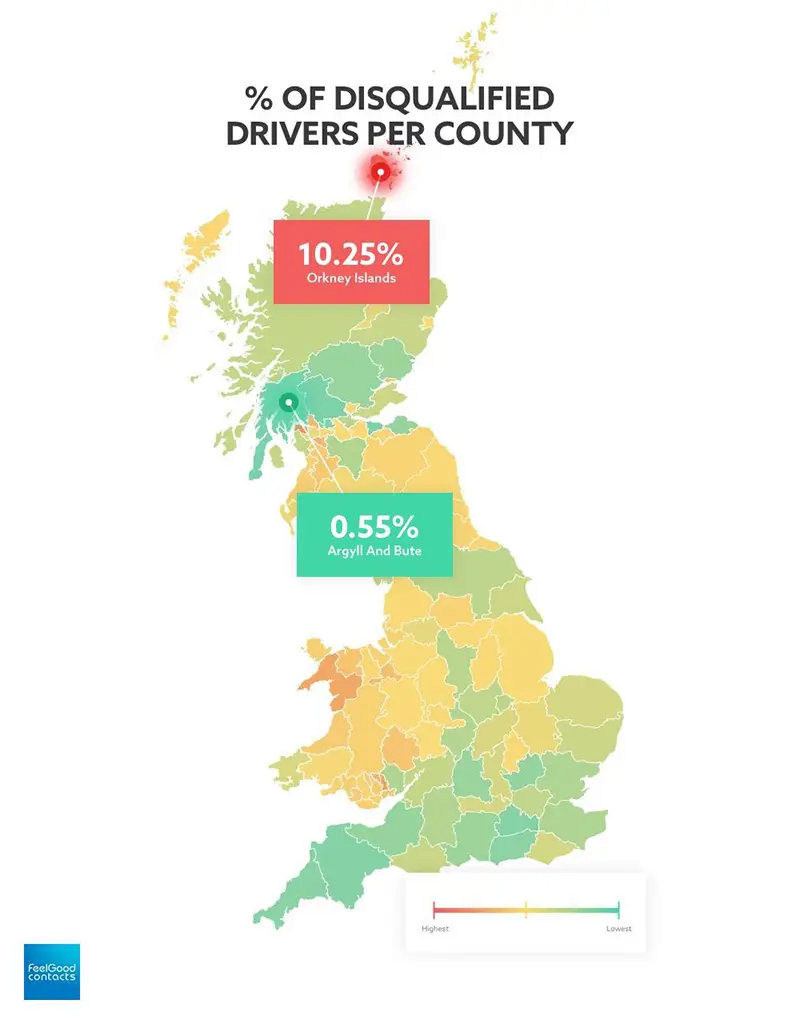
Upon analysis, we found that Wales actually made up half of the regions featured in the top 20, closely followed by Scotland with six. Four English regions also made an appearance with Herefordshire, Merseyside, Cleveland and West Yorkshire.
Worst Drivers by Region
The full top 20 list of disqualified drivers per region is as follows:- Orkney Islands (10.25%)
- Inverclyde (5.35%)
- Torfaen (4.79%)
- Gwent (3.34%)
- East Renfrewshire (3.20%)
- West Dunbartonshire (2.79%)
- Wrexham (2.70%)
- Dundee (2.69%)
- Herefordshire (2.33%)
- Newport (2.20%)
- Caerphilly (1.95%)
- Bridgend (1.90%)
- Port Talbot (1.76%)
- Vale of Glamorgan (1.70%)
- South Ayrshire (1.65%)
- Merseyside (1.52%)
- Cardiff (1.50%)
- Cleveland (1.45%)
- West Yorkshire (1.40%)
- Swansea (1.36%)
Whilst the reasons for these high number of disqualifications predominantly stem from the typical offences, such as speeding or drink driving, many are now being penalised for other offences including ‘careless driving’. This is where drivers are judged to be lacking awareness and attention for other road users.
Neil Greig, director of policy and research spokesman for UK road safety charity IAM RoadSmart, said: “With the winter months making road safety a top priority for many, the data highlights how many drivers are falling foul of the law at different rates across the country. While variations in police enforcement and vehicle types make comparisons difficult it is worrying that so many rural areas seem to have high numbers of people willing to break the law. This means that not only do road users have to look out for all the usual country road problems and the cold weather but also anticipate the actions of those around them. The message is clear; if you live in one of the areas highlighted then you will need all your observation skills to be as safe as possible on every trip.”
If you need advice on your eye health, be sure to read our Feel Good Contacts Eye care hub and always ensure you wear your contact lenses and prescriptive eyewear when driving, especially on the dangerous icy roads.
The full data from the DVLA can be found in the table below:
| County | 2014 | 2015 | 2016 | 2017 | % change (14-17) | 2018 | Total disqualified drivers | Total full license holders | % of all drivers who are disqualified |
| ORKNEY ISLANDS | 12 | 19 | 17 | 26 | 116.67% | 13 | 6,249 | 17014 | 10.25% |
| INVERCLYDE | 59 | 95 | 133 | 135 | 128.81% | 52 | 3,229 | 58986 | 5.35% |
| TORFAEN | 110 | 145 | 195 | 274 | 149.09% | 107 | 3,512 | 70199 | 4.79% |
| GWYNEDD | 102 | 162 | 227 | 248 | 143.14% | 145 | 2,827 | 87700 | 4.15% |
| BLAENAU GWENT | 91 | 137 | 196 | 189 | 107.69% | 93 | 2,733 | 48431 | 3.34% |
| EAST RENFREWSHIRE | 41 | 71 | 64 | 92 | 124.39% | 44 | 2,070 | 70498 | 3.20% |
| WEST DUNBARTONSHIRE | 75 | 125 | 152 | 159 | 112.00% | 63 | 2,231 | 69118 | 2.79% |
| WREXHAM | 157 | 250 | 291 | 329 | 109.55% | 189 | 2,663 | 101929 | 2.70% |
| DUNDEE CITY | 127 | 223 | 264 | 279 | 119.69% | 127 | 2,978 | 103302 | 2.69% |
| CONWY | 113 | 195 | 212 | 237 | 109.73% | 175 | 2,294 | 91013 | 2.45% |
| COUNTY OF HEREFORDSHIRE UA | 169 | 233 | 355 | 373 | 120.71% | 155 | 2,640 | 142332 | 2.33% |
| NEWPORT | 262 | 401 | 534 | 505 | 92.75% | 245 | 3,217 | 113379 | 2.20% |
| MERTHYR TYDFIL | 108 | 135 | 187 | 178 | 64.81% | 70 | 1,980 | 39437 | 2.20% |
| EAST AYRSHIRE | 106 | 214 | 200 | 219 | 106.60% | 103 | 2,380 | 89843 | 2.09% |
| CAERPHILLY | 230 | 385 | 461 | 462 | 100.87% | 277 | 3,036 | 133349 | 1.95% |
| CEREDIGION | 50 | 72 | 87 | 96 | 92.00% | 38 | 1,540 | 51345 | 1.91% |
| BRIDGEND | 150 | 278 | 281 | 296 | 97.33% | 158 | 2,074 | 110717 | 1.90% |
| NEATH PORT TALBOT | 166 | 278 | 272 | 320 | 92.77% | 158 | 2,449 | 102993 | 1.76% |
| ISLE OF ANGLESEY | 94 | 98 | 158 | 172 | 82.98% | 124 | 1,686 | 54904 | 1.70% |
| THE VALE OF GLAMORGAN | 111 | 157 | 207 | 224 | 101.80% | 94 | 1,844 | 99797 | 1.70% |
| SOUTH AYRSHIRE | 82 | 140 | 140 | 161 | 96.34% | 77 | 1,500 | 89191 | 1.65% |
| FLINTSHIRE | 182 | 270 | 304 | 344 | 89.01% | 204 | 2,094 | 116216 | 1.58% |
| POWYS | 98 | 157 | 183 | 196 | 100.00% | 94 | 1,802 | 106778 | 1.56% |
| MERSEYSIDE | 1258 | 2031 | 3812 | 203.02% | 2214 | 10,258 | 1016744 | 1.52% | |
| CARDIFF | 461 | 746 | 918 | 776 | 68.33% | 448 | 4,210 | 241386 | 1.50% |
| CLEVELAND | 747 | 1179 | 1530 | 1494 | 100.00% | 991 | 6,832 | 483667 | 1.45% |
| WEST YORKSHIRE | 2398 | 4354 | 5171 | 5134 | 114.10% | 3785 | 21,783 | 1626938 | 1.40% |
| RHONDDA CYNON TAFF | 316 | 441 | 537 | 534 | 68.99% | 283 | 2,983 | 173409 | 1.37% |
| SWANSEA | 311 | 550 | 630 | 478 | 53.70% | 313 | 2,878 | 175855 | 1.36% |
| SCOTTISH BORDERS | 67 | 116 | 124 | 131 | 95.52% | 56 | 1,317 | 92079 | 1.36% |
| MIDLOTHIAN | 86 | 107 | 157 | 158 | 83.72% | 68 | 1,387 | 68917 | 1.34% |
| CLACKMANNANSHIRE | 50 | 67 | 87 | 85 | 70.00% | 46 | 1,177 | 42628 | 1.33% |
| DURHAM | 500 | 881 | 1074 | 978 | 95.60% | 561 | 4,751 | 374261 | 1.29% |
| WEST MIDLANDS | 3132 | 5025 | 6159 | 6442 | 105.68% | 3806 | 25,259 | 2015440 | 1.27% |
| TYNE AND WEAR | 1031 | 1797 | 2061 | 2141 | 107.66% | 1128 | 8,758 | 759093 | 1.24% |
| EILEAN SIAR | 30 | 54 | 37 | 42 | 40.00% | 17 | 702 | 21035 | 1.23% |
| DENBIGHSHIRE | 115 | 137 | 192 | 180 | 56.52% | 140 | 1,332 | 72793 | 1.22% |
| BEDFORDSHIRE | 611 | 1056 | 1160 | 1323 | 116.53% | 696 | 5,461 | 523144 | 1.20% |
| WEST LOTHIAN | 148 | 227 | 262 | 283 | 91.22% | 164 | 1,633 | 137511 | 1.19% |
| NORTHUMBERLAND | 282 | 384 | 491 | 561 | 98.94% | 235 | 2,592 | 243334 | 1.16% |
| LANCASHIRE | 1506 | 2241 | 2644 | 3162 | 109.96% | 1652 | 11,757 | 1111430 | 1.12% |
| SOUTH YORKSHIRE | 1299 | 2295 | 2654 | 2516 | 93.69% | 1249 | 10,613 | 954345 | 1.11% |
| NOTTINGHAMSHIRE | 1216 | 1954 | 2048 | 2218 | 82.40% | 1264 | 9,335 | 816773 | 1.11% |
| SHROPSHIRE | 468 | 642 | 812 | 917 | 95.94% | 440 | 3,414 | 380935 | 1.08% |
| ABERDEEN CITY | 308 | 450 | 399 | 434 | 40.91% | 203 | 2,323 | 175171 | 1.07% |
| CHESHIRE | 995 | 1383 | 1916 | 2078 | 108.84% | 1166 | 8,139 | 850402 | 1.03% |
| STAFFORDSHIRE | 1076 | 1616 | 1981 | 2049 | 90.43% | 1096 | 8,305 | 838049 | 1.00% |
| WORCESTERSHIRE | 522 | 755 | 1002 | 1038 | 98.85% | 515 | 4,197 | 473009 | 1.00% |
| LINCOLNSHIRE | 1220 | 1826 | 1935 | 1881 | 54.18% | 1136 | 8,346 | 824550 | 0.98% |
| NORTH LANARKSHIRE | 337 | 525 | 534 | 556 | 64.99% | 318 | 2,712 | 247553 | 0.98% |
| EDINBURGH CITY OF | 271 | 459 | 503 | 565 | 108.49% | 319 | 2,407 | 340366 | 0.97% |
| CARMARTHENSHIRE | 219 | 246 | 321 | 342 | 56.16% | 187 | 1,678 | 149919 | 0.97% |
| DUMFRIES AND GALLOWAY | 135 | 202 | 240 | 217 | 60.74% | 127 | 1,206 | 116780 | 0.96% |
| GLASGOW CITY | 529 | 871 | 882 | 917 | 73.35% | 470 | 3,989 | 411324 | 0.96% |
| SHETLAND ISLANDS | 32 | 38 | 36 | 39 | 21.88% | 6 | 447 | 18106 | 0.94% |
| CAMBRIDGESHIRE | 855 | 1248 | 1315 | 1441 | 68.54% | 914 | 6,000 | 641642 | 0.93% |
| RENFREWSHIRE | 149 | 274 | 211 | 258 | 73.15% | 115 | 1,289 | 132572 | 0.93% |
| GREATER MANCHESTER | 2601 | 4133 | 4330 | 4581 | 76.12% | 2596 | 18,466 | 2004572 | 0.92% |
| MORAY | 89 | 144 | 124 | 132 | 48.31% | 71 | 827 | 72554 | 0.91% |
| NORTHAMPTONSHIRE | 820 | 1141 | 1121 | 1304 | 59.02% | 697 | 5,353 | 587541 | 0.89% |
| PEMBROKESHIRE | 113 | 172 | 215 | 167 | 47.79% | 101 | 1,001 | 96203 | 0.89% |
| NORFOLK | 767 | 1155 | 1264 | 1482 | 93.22% | 839 | 5,775 | 692442 | 0.88% |
| BERKSHIRE | 834 | 1287 | 1361 | 1635 | 96.04% | 845 | 6,184 | 750439 | 0.87% |
| BUCKINGHAMSHIRE | 713 | 984 | 1151 | 1395 | 95.65% | 689 | 5,207 | 657715 | 0.87% |
| EAST SUSSEX | 511 | 953 | 1025 | 1087 | 112.72% | 542 | 4,308 | 633524 | 0.87% |
| FIFE | 360 | 503 | 564 | 530 | 47.22% | 253 | 2,362 | 274176 | 0.85% |
| EAST YORKSHIRE | 564 | 817 | 919 | 854 | 51.42% | 457 | 3,742 | 437513 | 0.85% |
| SUFFOLK | 599 | 874 | 1043 | 1159 | 93.49% | 756 | 4,614 | 587921 | 0.84% |
| DORSET | 639 | 878 | 1083 | 1216 | 90.30% | 758 | 4,757 | 620228 | 0.84% |
| ABERDEENSHIRE | 253 | 366 | 396 | 392 | 54.94% | 187 | 1,748 | 205496 | 0.84% |
| NORTH AYRSHIRE | 133 | 174 | 158 | 187 | 40.60% | 107 | 946 | 101911 | 0.83% |
| GLOUCESTERSHIRE | 479 | 706 | 851 | 929 | 93.95% | 513 | 3,612 | 505360 | 0.83% |
| CUMBRIA | 476 | 635 | 700 | 789 | 65.76% | 483 | 3,286 | 393837 | 0.82% |
| HIGHLAND | 259 | 346 | 315 | 349 | 34.75% | 194 | 1,595 | 186342 | 0.82% |
| GREATER LONDON | 7976 | 12551 | 12995 | 14070 | 76.40% | 7941 | 55,713 | 6893909 | 0.81% |
| LEICESTERSHIRE | 1000 | 1405 | 1462 | 1551 | 55.10% | 961 | 6,542 | 806601 | 0.81% |
| FALKIRK | 148 | 195 | 242 | 199 | 34.46% | 94 | 1,005 | 118567 | 0.80% |
| NORTH YORKSHIRE | 643 | 1031 | 1110 | 1179 | 83.36% | 635 | 4,733 | 631328 | 0.80% |
| DERBYSHIRE | 815 | 1275 | 1407 | 1477 | 81.23% | 955 | 6,064 | 782256 | 0.79% |
| AVON | 991 | 1451 | 1461 | 1637 | 65.19% | 1052 | 6,718 | 858606 | 0.79% |
| WARWICKSHIRE | 473 | 695 | 794 | 810 | 71.25% | 424 | 3,308 | 445014 | 0.78% |
| WILTSHIRE | 555 | 732 | 933 | 1036 | 86.67% | 533 | 3,906 | 572669 | 0.77% |
| MONMOUTHSHIRE | 79 | 103 | 137 | 107 | 35.44% | 66 | 608 | 74935 | 0.77% |
| SOUTH LANARKSHIRE | 276 | 389 | 410 | 433 | 56.88% | 216 | 1,822 | 246685 | 0.76% |
| KENT | 1537 | 2264 | 2510 | 2675 | 74.04% | 1491 | 10,568 | 1416466 | 0.76% |
| ESSEX | 1427 | 2274 | 2459 | 2637 | 84.79% | 1673 | 10,573 | 1438452 | 0.75% |
| HAMPSHIRE | 1600 | 2400 | 2404 | 2538 | 58.63% | 1535 | 10,561 | 1534691 | 0.69% |
| ANGUS | 103 | 130 | 135 | 131 | 27.18% | 85 | 699 | 89526 | 0.69% |
| OXFORDSHIRE | 468 | 661 | 736 | 870 | 85.90% | 452 | 3,281 | 536136 | 0.69% |
| PERTH AND KINROSS | 101 | 184 | 174 | 152 | 50.50% | 71 | 760 | 113379 | 0.68% |
| SOMERSET | 502 | 614 | 651 | 725 | 44.42% | 445 | 3,023 | 451177 | 0.67% |
| EAST LOTHIAN | 78 | 98 | 110 | 112 | 43.59% | 54 | 540 | 79314 | 0.67% |
| HERTFORDSHIRE | 979 | 1326 | 1397 | 1620 | 65.47% | 917 | 6,318 | 968580 | 0.66% |
| WEST SUSSEX | 568 | 1066 | 1051 | 1078 | 89.79% | 559 | 4,404 | 700618 | 0.64% |
| CORNWALL AND ISLES OF SCILLY | 435 | 574 | 656 | 671 | 54.25% | 343 | 2,747 | 446348 | 0.63% |
| SURREY | 855 | 1357 | 1426 | 1419 | 65.96% | 876 | 6,004 | 1004258 | 0.61% |
| DEVON | 827 | 1160 | 1371 | 1346 | 62.76% | 764 | 5,526 | 920218 | 0.61% |
| STIRLING | 59 | 100 | 72 | 77 | 30.51% | 47 | 391 | 71375 | 0.58% |
| CITY OF EDINBURGH | 9 | 12 | 20 | 11 | 22.22% | 9 | 72 | 12566 | 0.57% |
| EAST DUNBARTONSHIRE | 61 | 85 | 92 | 101 | 65.57% | 31 | 390 | 88235 | 0.57% |
| ARGYLL AND BUTE | 72 | 87 | 87 | 74 | 2.78% | 54 | 383 | 69340 | 0.55% |
| UNKNOWN | 494 | 831 | 885 | 844 | 70.85% | 507 | 6,092 | 61519 | 6.23% |
The data was collected from the Driver and Vehicles Licensing Agency from January 2014 to July 2018. The disqualification percentage was calculated from the number of drivers disqualified compared to the number of those with full licences in their respective areas. The unknown category of drivers indicates the DVLA does not hold sufficient location data for these road users.
Disclaimer: The advice and suggestions in this blog are for informational purposes only and are not a substitute for medical care. Before trying any products or remedies, consult with an eye care professional. See our Editorial Policy for details on how we review our blog.